


Buy this modern artwork Map of Sneek abstract by Maps Are Art on canvas, ArtFrame, poster and wallpaper, printed on demand in high quality.
About "Map of Sneek abstract"
by Maps Are Art
About the artwork
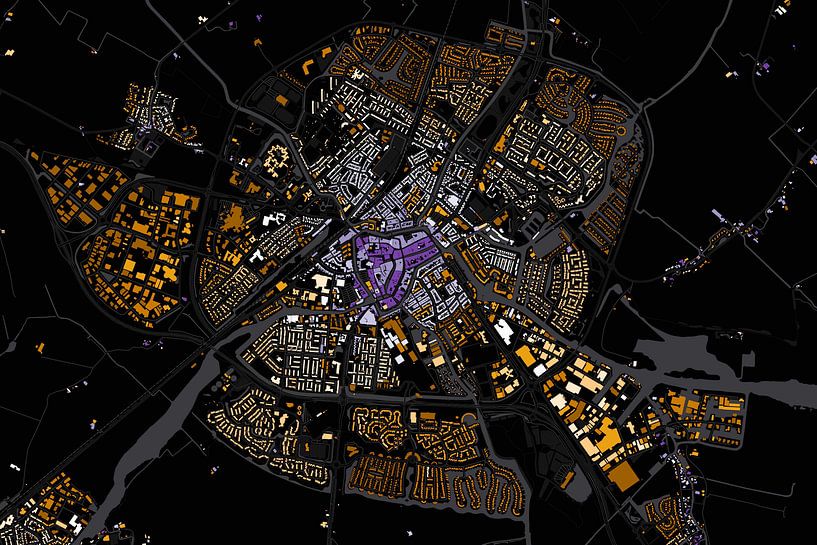
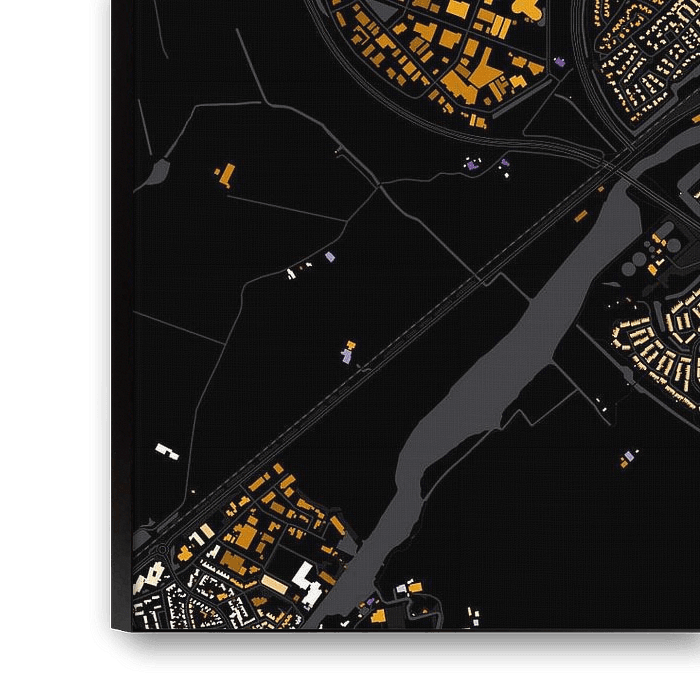
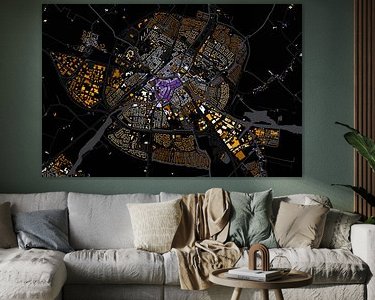
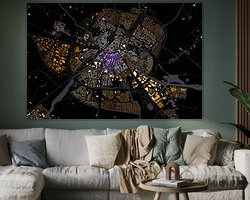
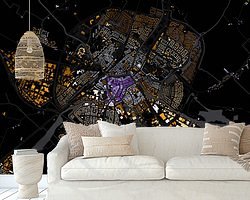
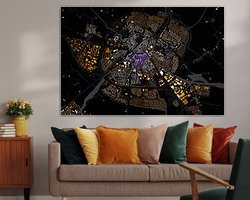
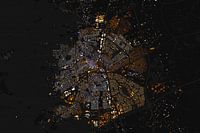
The coloured areas on the map are all the buildings of the city of Sneek. Each decade of the last century has a separate colour. Blue is the oldest, from before 1900, and brown/Orange areas are the most recently built. In the town centre, all the buildings that stand against each other are coloured according to the oldest building in the row. This makes the old city centre more visible.
On my youtube channel: De Kaartkunstenaar, there is a short film showing the expansion of Sneek dynamically on the map.
The data of the buildings with the year comes from the BAG, the basic registration of all buildings and addresses in the Netherlands. The map itself was created using a combination of different programming methods and it was finished by hand in graphics editing programmes. Besides this map of Sneek, maps of other major Dutch cities can also be found in this collection.
About Maps Are Art
Mapmaker, geography enthusiast, GIS expert and all-round creative... Read more…
 Architecture
 Digital art
 Friesland
 Modern
 Mysterious Spheres
 Serene Peace
 World and country maps
 Netherlands
 Ordered in February 2022
 Germany
 Ordered in November 2020
Germany
Ordered in September 2020
Germany
Ordered in October 2019
Germany
Ordered in February 2021
Germany
Ordered in August 2025
Germany
Ordered in June 2019
Germany
Ordered in July 2020
Germany
Ordered in August 2025
Germany
Ordered in October 2019
Netherlands
Ordered in October 2021
Germany
Ordered in April 2021
Ordered in November 2020
Germany
Ordered in September 2020
Germany
Ordered in October 2019
Germany
Ordered in February 2021
Germany
Ordered in August 2025
Germany
Ordered in June 2019
Germany
Ordered in July 2020
Germany
Ordered in August 2025
Germany
Ordered in October 2019
Netherlands
Ordered in October 2021
Germany
Ordered in April 2021
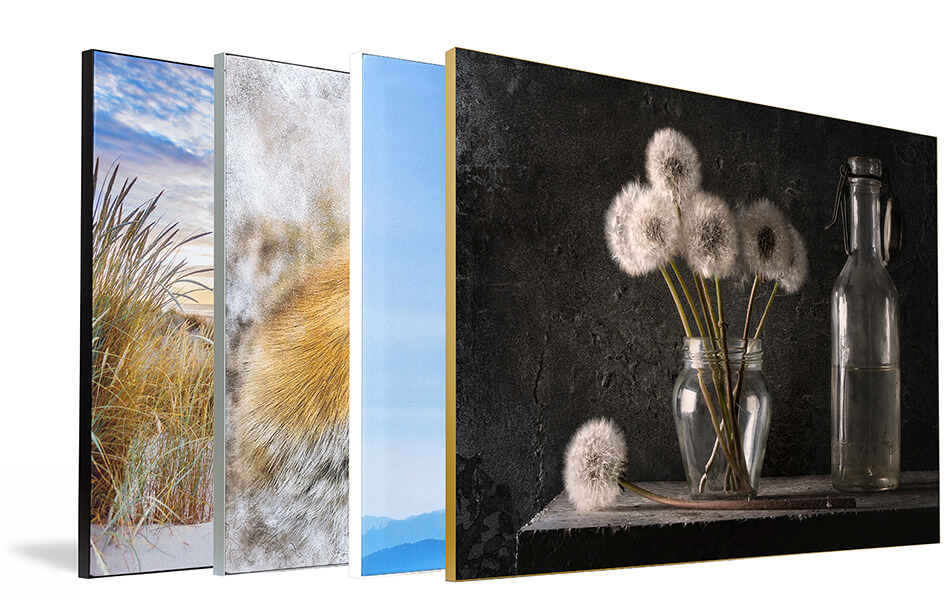
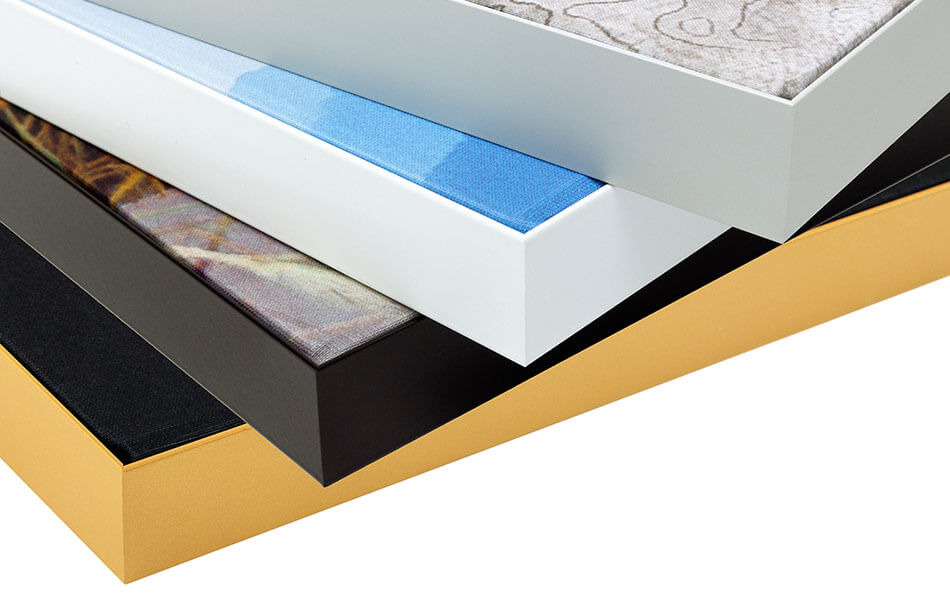
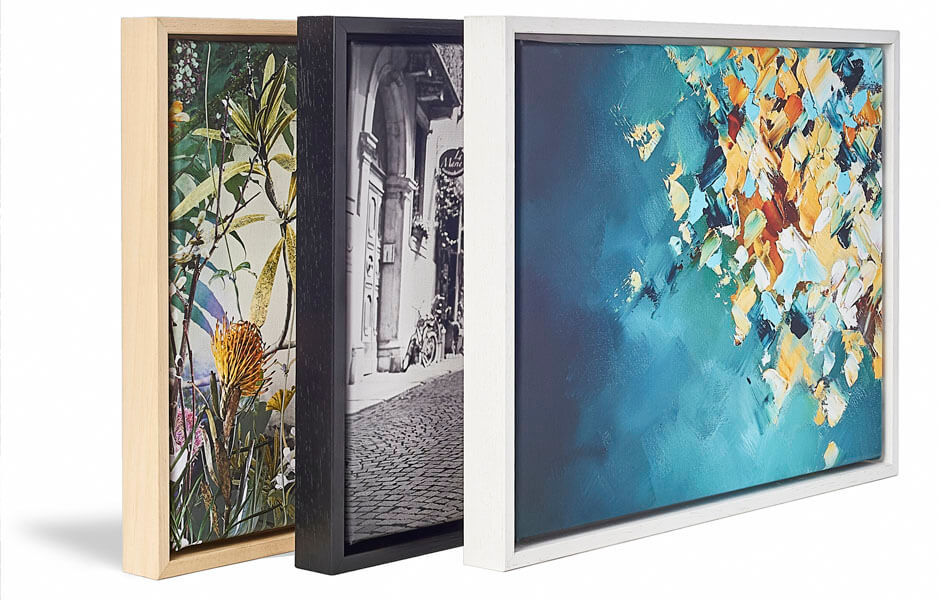
About the material
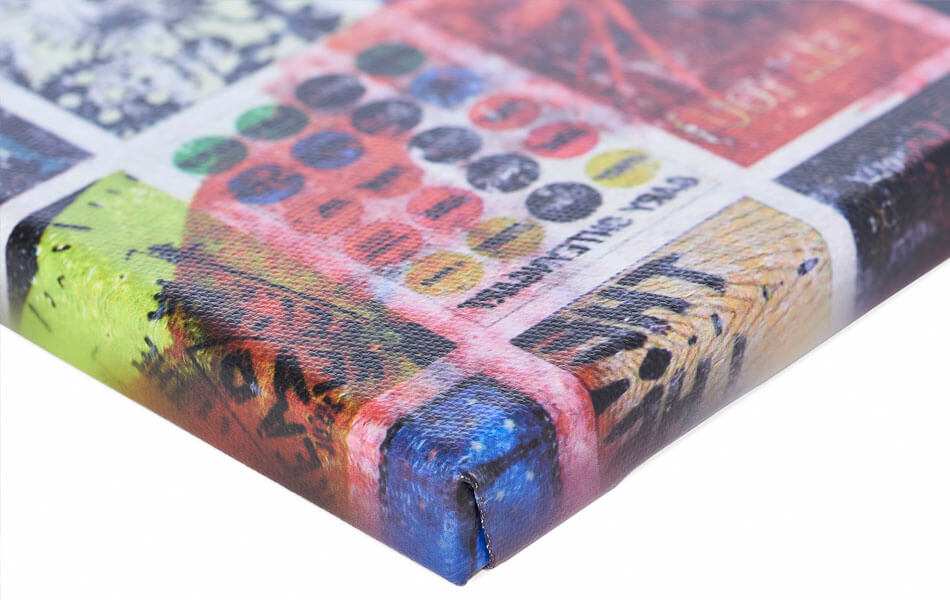
ArtFrame™
Interchangeable Art Prints
- High-quality print
- Easily interchangeable
- Acoustic function
- Large sizes available
Discover the artworks of Maps Are Art
 Map of Apeldoorn abstractMaps Are Art
 Map of Breda abstractMaps Are Art
 Map of Maastricht abstractMaps Are Art
 Kaart van MiddelburgMaps Are Art
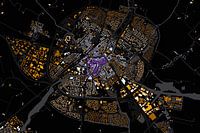 Map of Sneek abstractMaps Are Art
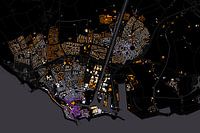 Map of Flushing abstractMaps Are Art
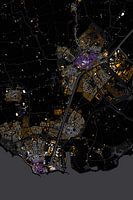 Abstract map Middelburg and VlissingenMaps Are Art
 Nijmegen Art Nouveau MapMaps Are Art
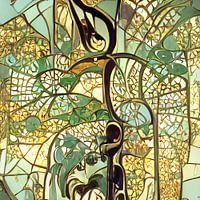 Maastricht Art Nouveau MapMaps Are Art
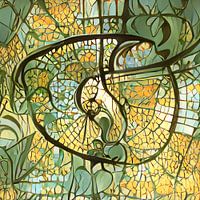 Eindhoven Art Nouveau MapMaps Are Art
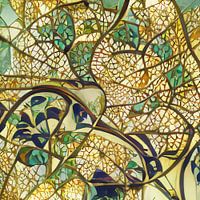 Arnhem Art Nouveau MapMaps Are Art
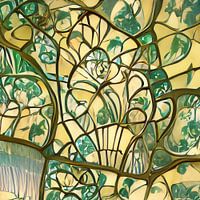 Urecht Jugendstil MapMaps Are Art
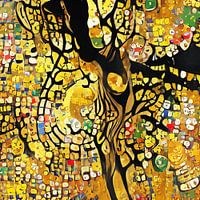 Map of Amsterdam in the style of Gustav KlimtMaps Are Art
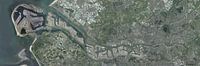 Panoramic aerial photo of Rotterdam EuropoortMaps Are Art
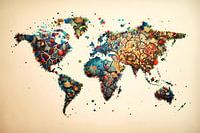 Vibrant world mapMaps Are Art
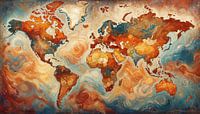 Van Gogh-style world mapMaps Are Art
 Impressionistic world map mer Wabi Sabi coloursMaps Are Art
 Colourful impressionist world mapMaps Are Art
 Impressionistic world map in light coloursMaps Are Art
 Impressionistic world map with intense colours.Maps Are Art